Ludving Cano
Atmospheric Science & Astronomy
Research Assistant, Laboratory for Atmospheric Physics UMSA
BSc in Physics, Universidad Mayor de San Andrés
Contact: lcanof [at] chacaltaya.edu.bo
CV
View My LinkedIn Profile
Automation projects
Back to Atmospheric Physics Projects
These three projects are pretty similar, all of them use Github Actions for generating plots and retrieving data from different sources. The advantages of using this tool are: 1) We don’t have to have a computer running all the time. 2. Compared to downloading into a local file, downloading data from the cloud to the cloud (in this case the Github repo) is way quicker. And 3. It’s free! (with limits).
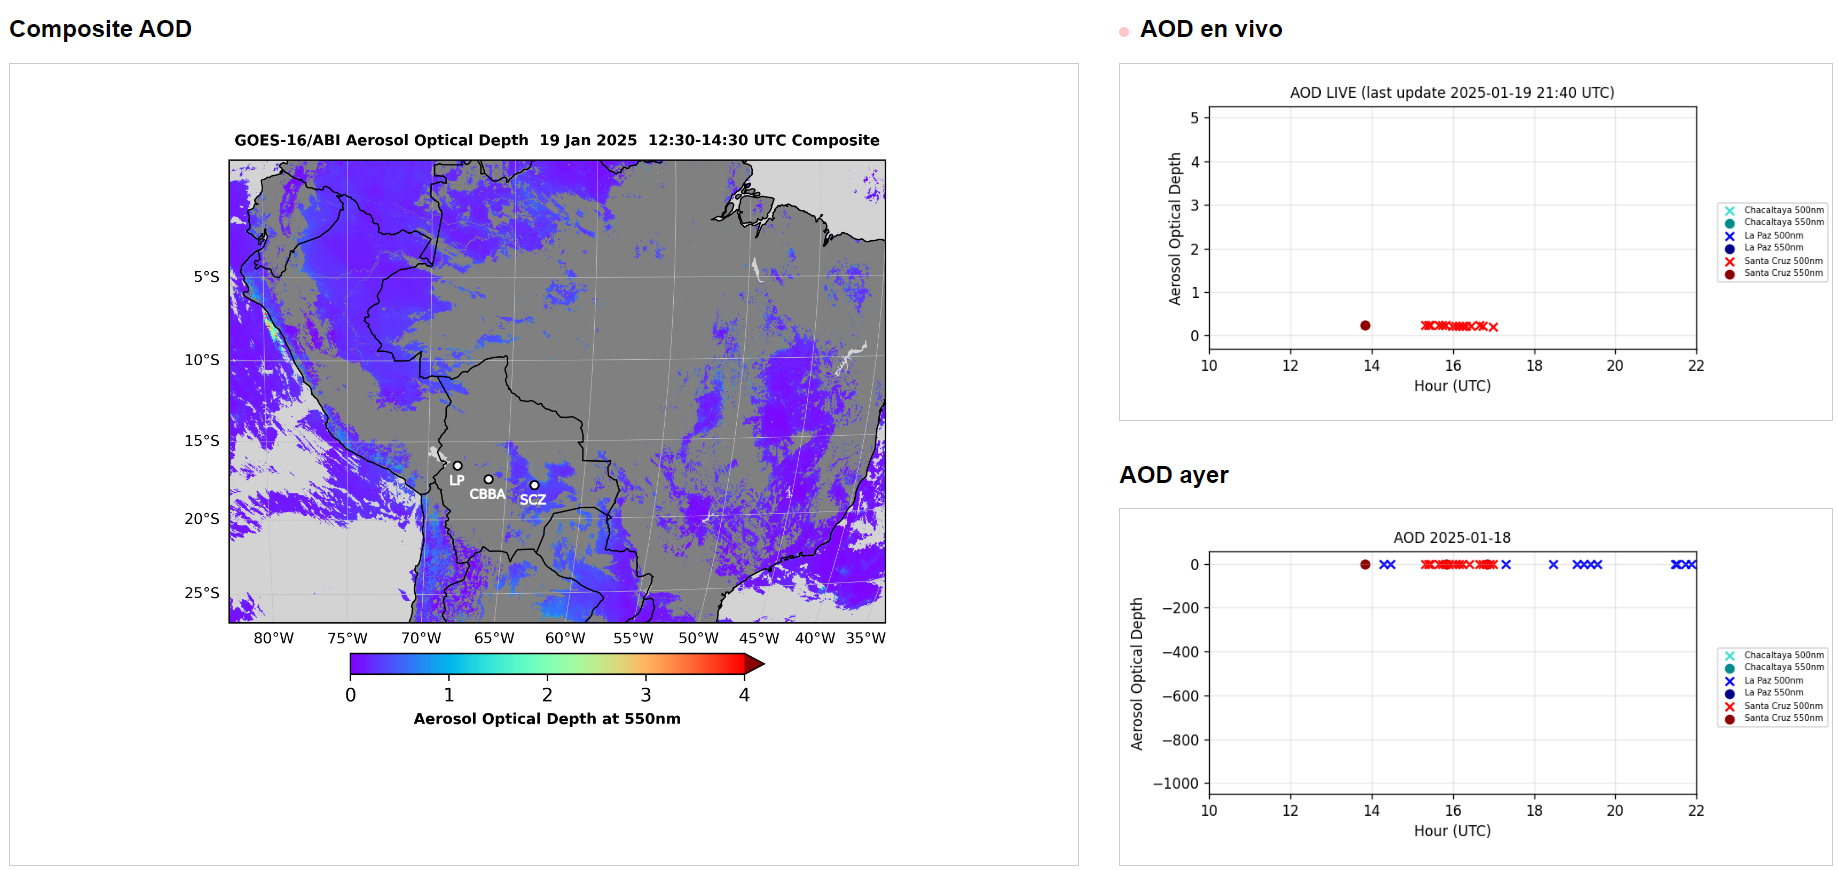
AOD Plotting
In 2023 and 2024, Bolivia saw an important increase in wildfires1, for several days, cities even in the Andes a decrease in air quality, this tool was developed for monitoring the AOD for Bolivia (closely related to emissions from the burning season).
Check out the Github Repo

Check this project running live
This project retrieves data for three places of interest: Mount Chacaltaya (GAW Station), Cota Cota Campus (LFA), and Santa Cruz (UTEPSA), these three locations have an AERONET Instrument that measures AOD, to compare this with a satellite measurement, data from GOES is retrieved and the pixel value for the stations is plotted too. This code runs (almost) 4 times each hour2. All these plots must be saved in the same repository and the time series for future use.
Below an example:
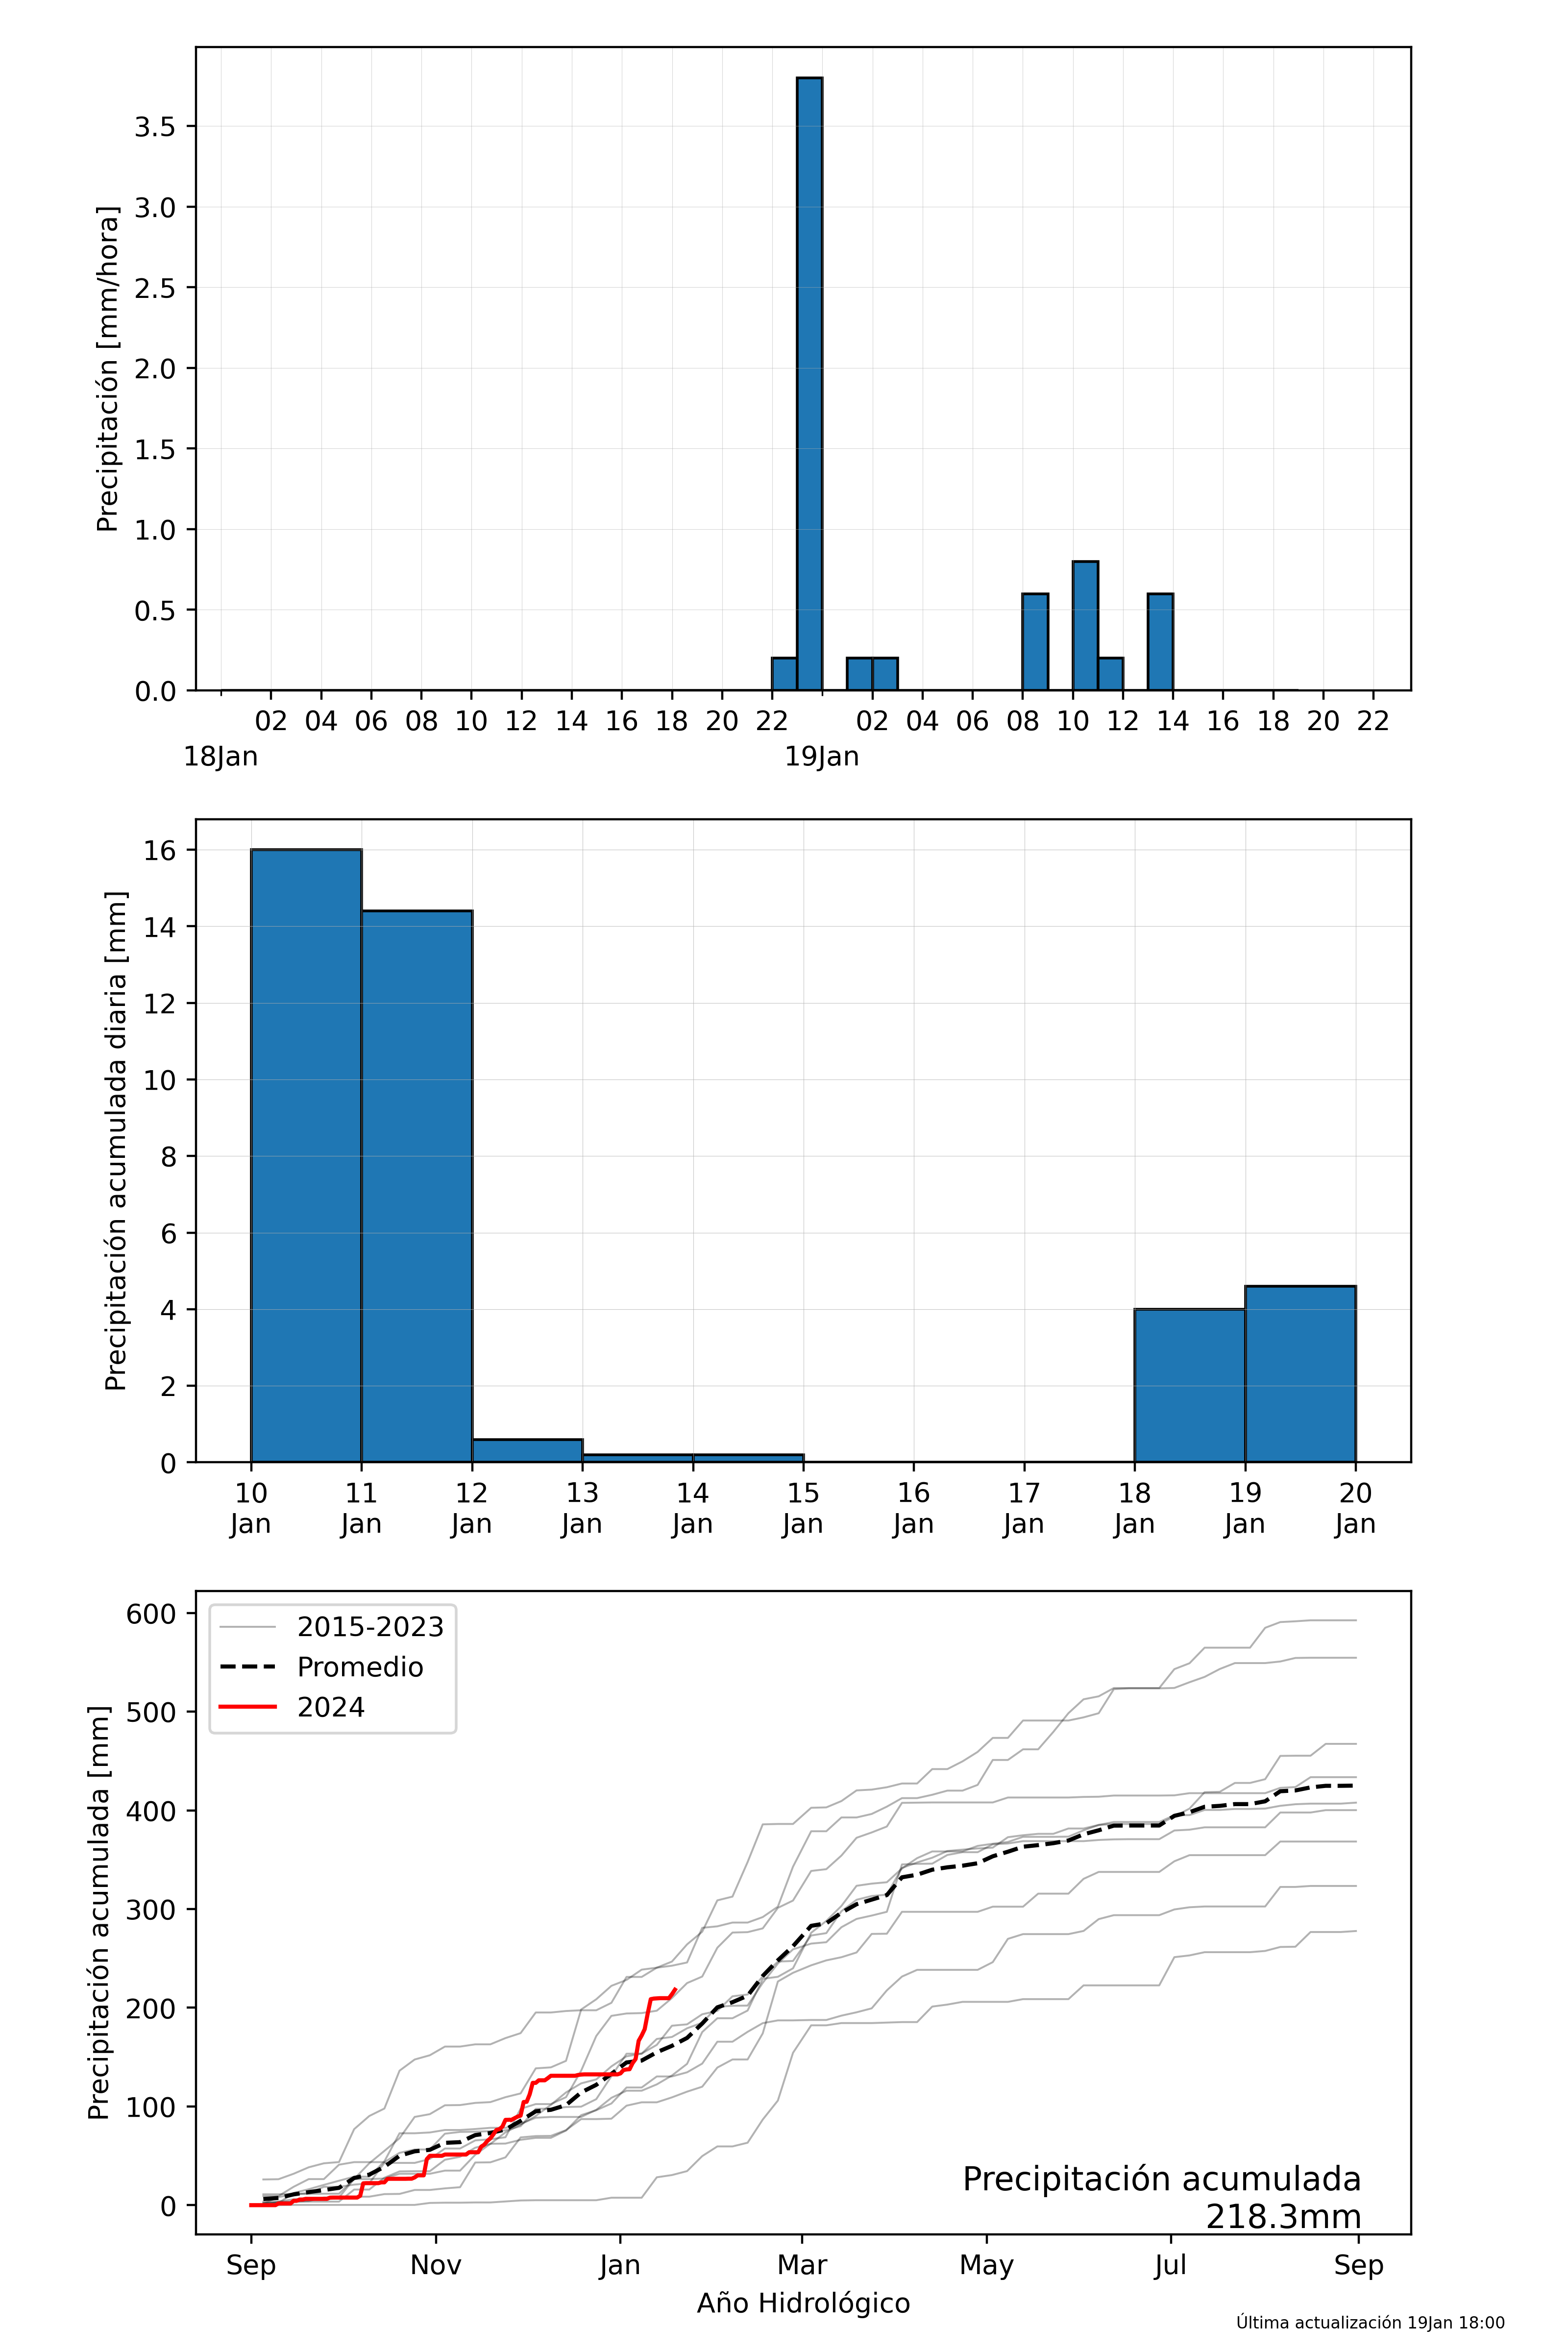
Pluviometry Plotting
Check out the Github Repo

Check this project running live
)
La Paz is a complicated city, it was built practically above more than 300 rivers. The consequence? In the rainfall season, the bigger rivers become a problem. Also,the effects of El Niño and Niña in the precipitation per year is still a topic to be fully understood, this small tool retrieves data from two Davis Stations (Campus Cota Cota and on the way to Chacaltaya) and plots the cumulative rainfall and some other event-related plots. This code also runs automatically 3 times per hour 2.
This project is intended to grow, probably we can retrieve data from cities that don’t have professional weather stations using airports’ reports? Contact me if you have suggestions! :sweat_smile:
The plot generated:
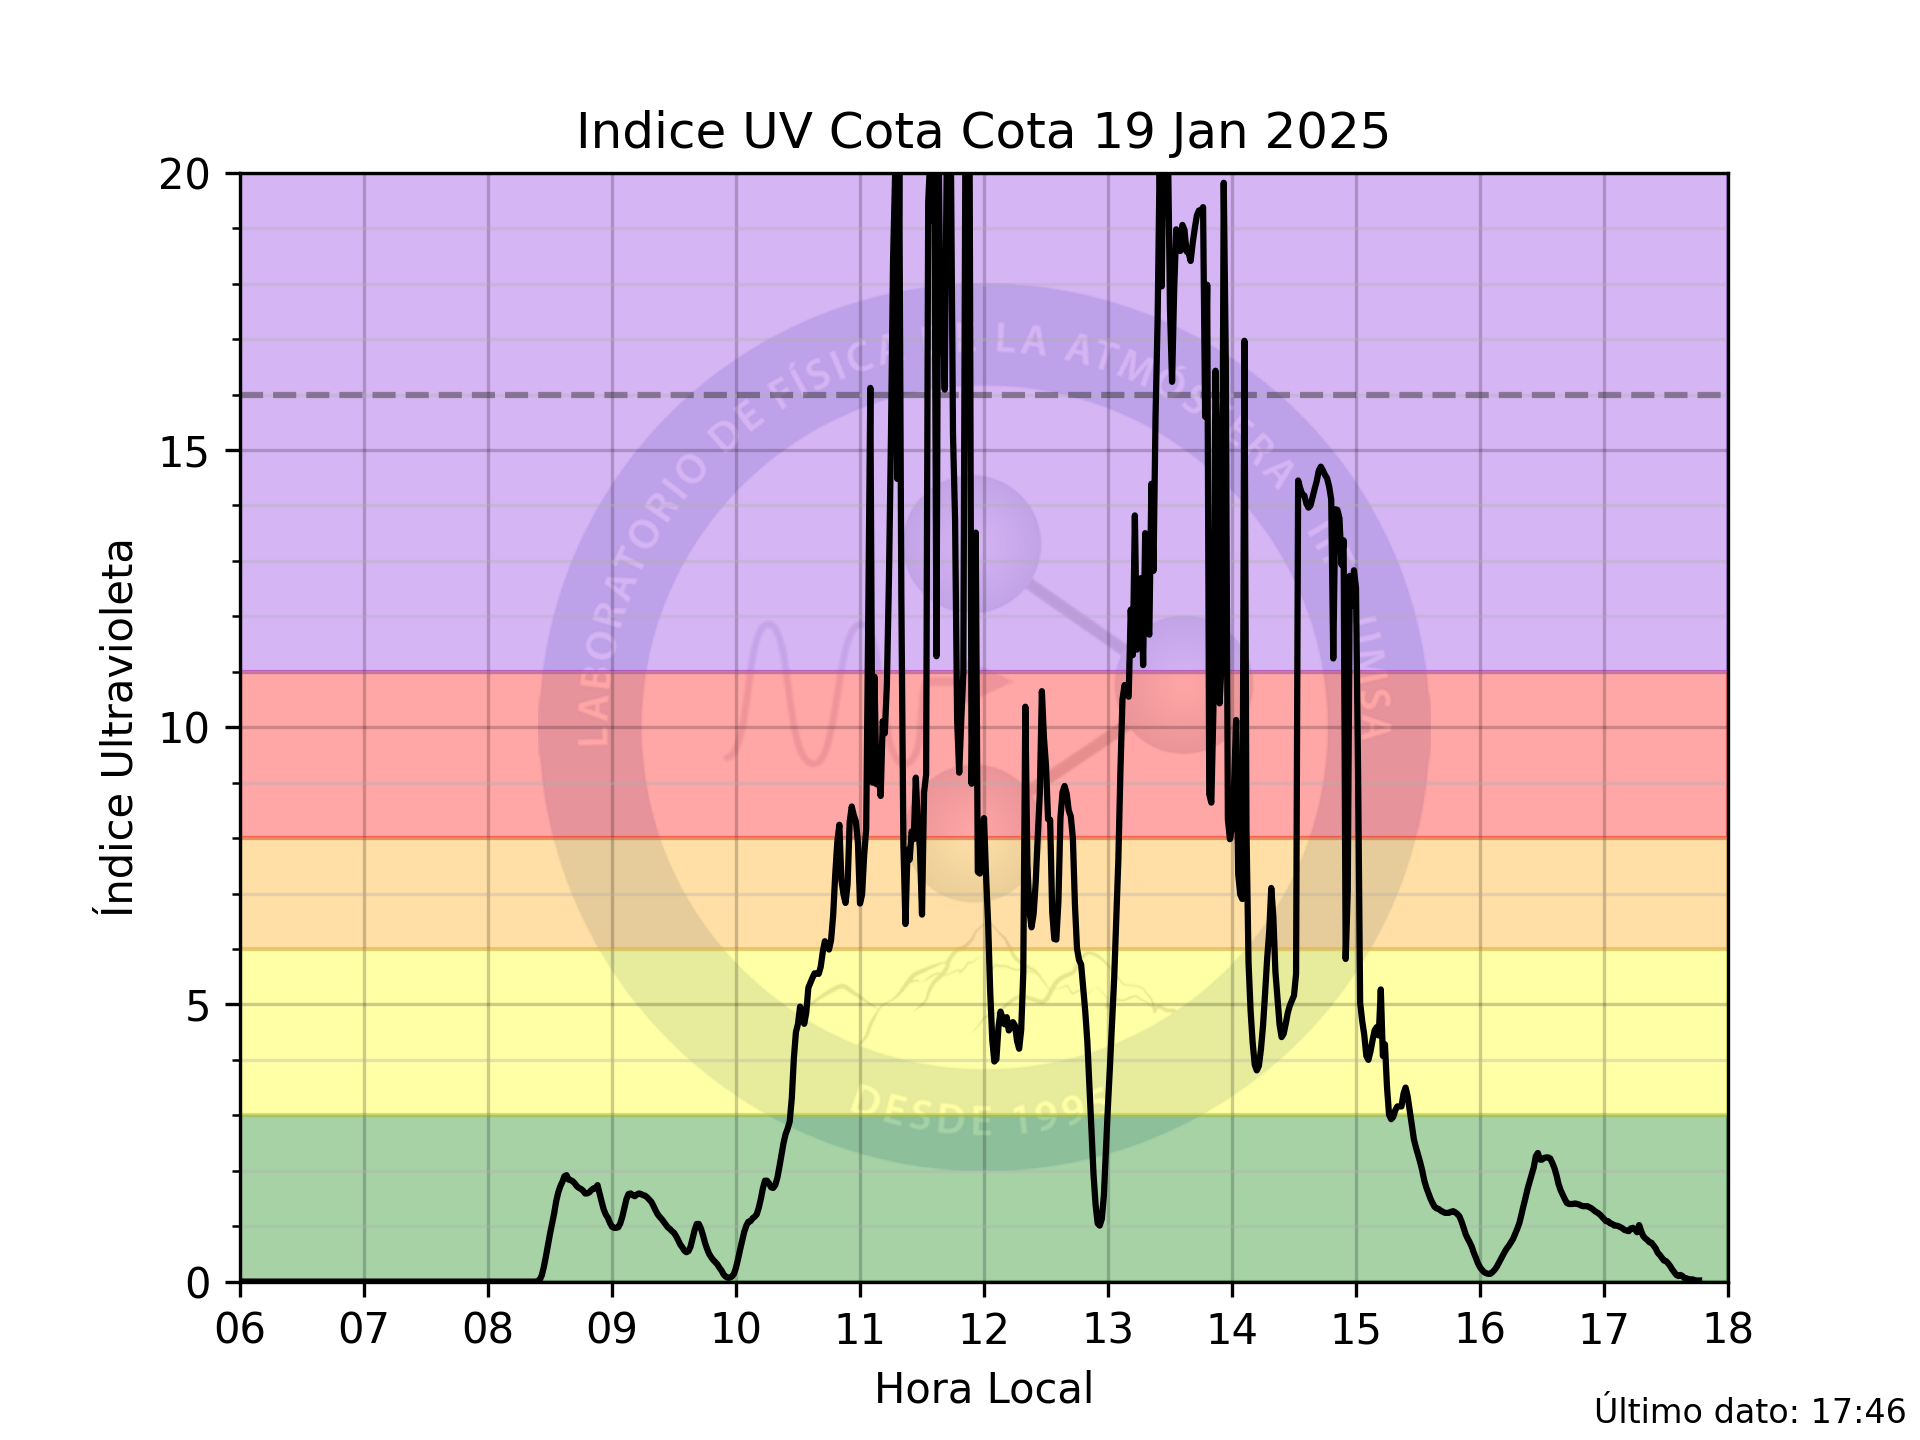
UV Index Plotting
Check out the Github Repo

Check this project running live
La Paz again! At an altitude of approximately 3,600 meters above sea level, we face challenges with UV radiation (check out this interview with a researcher from the lab (in Spanish)), as the UV index can exceed 15. In such cases, it’s crucial for the public to take precautions and follow recommended guidelines3. This code retrieves UV index data from an API provided by the lab technician and generates a user-friendly UV plot. While this page isn’t designed for scientific purposes, it serves as an outreach tool to raise awareness. This code also runs automatically 4 times per hour 2.
This project is intended to grow, probably using satellite images and generate the same plot for different cities?. Contact me if you have suggestions! :sweat_smile:
The plot generated:
-
Read the Copernicus Atmosphere Monitoring Service report on wildfires ↩
-
Github Actions lets you schedule the times for the code to run, nonetheless this is almost never accomplished, sometimes it can stop working for some hours or not follow the scheduled times. ↩ ↩2 ↩3
-
For more information a good book for reference is Radiación Ultravioleta en Bolivia (Spanish) ↩